Halley undertook his Atlantic voyages to measure the magnetic variation at sea. Magnetic variation (or declination) is the angle between magnetic and geographic north in a horizontal plane. Halley thought that if a pattern could be observed in the variation, it might offer a way to determine a ship’s longitude at sea. He measured the variation regularly throughout his two voyages and began preparing the presentation of his data as soon as he arrived back in Deptford in September 1700.
Halley is noted for his ability to draw general conclusions from complex data and for his appreciation of visual representation of those conclusions, and he demonstrated both these traits in presenting his data in the form of a sea chart.
The chart – known as his Atlantic Chart – holds an important place in the history of cartography, as it is regarded as the first published chart to represent magnetic declination using what became known as isogonic lines. It was not the first time such lines had been thought of, but the earlier examples were never published and Halley is thought unlikely to have known about them. [1]
We’ll look at the chart and its data in a moment, but first I’d like to highlight some of its decorative features.

To the east of the mysterious birds, we find The Icey Sea with the black-streaked “Mountains of Ice” that Halley and his crew had encountered in February (notice their track passing through it). Neither Halley nor his crew had seen icebergs before and Halley was unsure whether they were floating or grounded.
The track of Halley’s second voyage is shown on the chart and indicated by representations of the Paramore pursuing her figure-of-eight course.
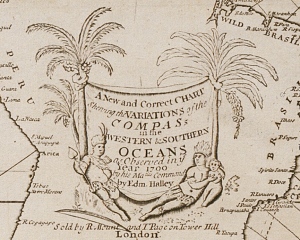
There are three cartouches on the chart: the one on South America is formed by a native family reclining beneath two fruit-laden palm trees. The adults wear feathered headdresses and skirts, the woman clutches a small child and the man holds a spear, has a bow at his feet and a quiver of arrows on his back. Behind them, hanging between the trees, is a sheet bearing the chart’s title:
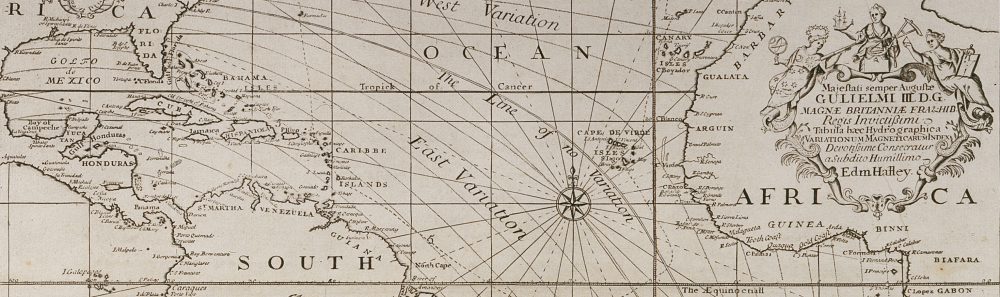
A New and Correct CHART Shewing the Variations of the COMPASs in the WESTERN & SOUTHERN OCEANS as Observed in ye Year 1700 by his Ma:ties Command by Edm. Halley.

A second cartouche appears on the landmass of Africa and carries the chart’s dedication to William III and is topped by personifications of astronomy (holding a telescope and armillary sphere), navigation (a backstaff and ship) and mathematics (dividers and triangle).
The third cartouche is found on North America and explains the information depicted in the chart:
The Curve Lines which are drawn over the Seas in this Chart, do shew at one View all the places where the Variation of the Compass is the same; The Numbers to them, shew how many degrees the Needle declines either Eastwards or Westwards from the true North; and the Double Line passing near Bermudas and the Cape de Virde Isles is that where the Needle stands true, without Variation.
And here’s the full chart, shown with the permission of the Royal Geographical Society:

Halley’s Atlantic Chart (© Royal Geographical Society (with IBG) (£), Image S0015919)
You can see that it has two compass roses, the one in the mid-Atlantic radiating lines that somewhat obscure Halley’s “Curve Lines” of equal magnetic declination. (Halley himself realised this was a problem and omitted this feature on the World Chart he published around a year later.) It is on a Mercator projection, with lines of latitude and longitude, and the meridian of London, the equator and tropics identified, but no indication of scale.
This version of the chart includes text that was written subsequently by Halley and printed in two strips that could be stuck to the sides of the original chart. It describes how to consult the chart by way of examples, and explains that it has two uses:
- to enable the mariner to know by how much he needs to adjust his course to take account of the magnetic variation, and
- to estimate a ship’s longitude at sea, the curve lines running nearly north-south (as off the west cost of Africa) giving “a very good Indication of the Distance of the Land” from the ship
This useful knowledge is obtained by reference to the isogonic lines. They are a little difficult to pick out but you can easily see the double curved line to the right of the central compass, which Halley has named The Line of No Variation (the agonic line) and the curved lines above and right show the degree to which the compass varies west of geographic north, and to the left, east of geographic north (the number of degrees of variation is shown on the horizontal line above The Icey Sea).
As mentioned above, the chart was (and is) regarded as the first (extant) published use of isolines (contour lines), and until the nineteenth century these lines were known as Halleyan lines.
So the chart is impressive and historically important, but how accurate was it? Alan Cook observed that it was “an improvement on anything that had gone before”, [2] but as I wrote in a previous post, the problem with longitude is knowing both where you are and where the place is that you’re heading. Halley’s recorded longitude was often inaccurate and sometimes considerably so: when he was sailing towards St Helena from the east, the longitude value he reported is actually west of the island – and so the degree of variation he thought applied to the east of the island in fact applied to the west.
Similarly the coordinates of islands and land weren’t then accurately known: Cape Horn, for example, is roughly 10° further west on Halley’s chart than we now know it to be, so his lines of variation near that coast must be likewise misplaced. [3] It seems to me that the moral of this exercise is that to devise a chart that helps estimate a ship’s longitude at sea, the deviser needs to have a fairly accurate knowledge of longitude in the first place.
But Halley was alert to the likelihood of error in his chart and in his final paragraph he wrote that:
…all knowing Mariners are desired to lend their Assistance and Informations, towards the perfecting of this useful Work. And if by undoubted Observations it be found in any Part defective, the Notes of it will be received with all grateful Acknowledgment, and the Chart corrected accordingly.
And I think that’s how Halley’s chart was most useful: it was a cartographic innovation from which better and more accurate maps might evolve.
_______________
[1] For details of prior manuscript isoline charts see Thrower, The Three Voyages of Edmond Halley in the Paramore 1698-1701 (Hakluyt Society: London, 1981) pp 57-58, and Thrower, Maps & Civilization (3rd ed, Chicago and London, 2008) pp 97-101.
[2] Cook, Edmond Halley: Charting the Heavens and the Seas (Oxford, 1998) p 281.
[3] In 1714 Halley defended his World Chart (an extended version of his Atlantic Chart, incorporating data supplied by others) in the Philosophical Transactions from charges of inaccuracy by the French Royal Academy of Sciences, including that he had placed Cape Horn too far west.
All images © Royal Geographic Society (with IBG) (£), Ref S0015919.

Heartfelt thanks Kate for this enthralling series of Tweets and Posts. Highly appreciated by myself and many others interested English Naval history. I wonder how the Chinese Junks of the Ming Imperial Navy navigated their way to Africa, the Philippines, Spice islands and perhaps further into the Pacific? Perhaps there are charts or travel documents somewhere archived in China which might shed interesting light on their adventures? We need a Chinese ‘Kate’! Best wishes. Bob.
Thanks very much, Bob – and for your support of Edmond during his voyages. I know nothing about Chinese maritime history, but while researching Halley’s voyages I’ve had a strong sense of a parallel world operating on the seas, with its busy routes and ports, and I’m sure the perspective of the Chinese contingent would make for interesting reading. (And of course your own part of the world has an impressive maritime history!)
Pingback: Whewell’s Gazette: Vol. #15 | Whewell's Ghost