Halley’s Channel Chart
Halley probably published the chart depicting the data he collected on his third voyage in 1702. The example shown here (of the western half) is of a later date as it refers to “Dr Halley”, and Halley received his honorary doctorate from Oxford in 1710. I discuss the chart more in this post.

Western section of Halley’s Channel Chart (© Royal Geographical Society (with IBG) (£), Image No S0015918)
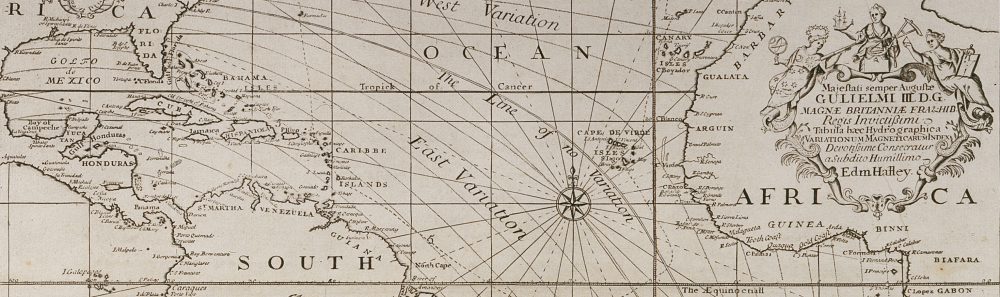
Halley’s Atlantic Chart
Halley published his data of magnetic variation in the form of a sea chart in 1701. The chart was the first published chart to use isogonic lines to join points of equal magnetic declination. You can read more about this innovative chart in my post here.

Halley’s Atlantic Chart (© Royal Geographical Society (with IBG) (£), S0015919)
Track of Halley’s second voyage
This shows the approximate track of Halley’s second voyage, sailing in a figure of eight from London to South America, then passing just north of South Georgia towards Africa, turning towards the Caribbean at St Helena, before heading home via the North American coast. (Source – link to Source deleted as now marked Unsafe).

Track of Halley’s first voyage
This map shows the track of Halley’s first voyage, from London to South America and back via the West Indies (sorry it’s a rather poor photo).
The map appears in Norman Thrower’s The Three Voyages of Edmond Halley in the Paramore 1698-1701 and is shown with the permission of the Hakluyt Society.
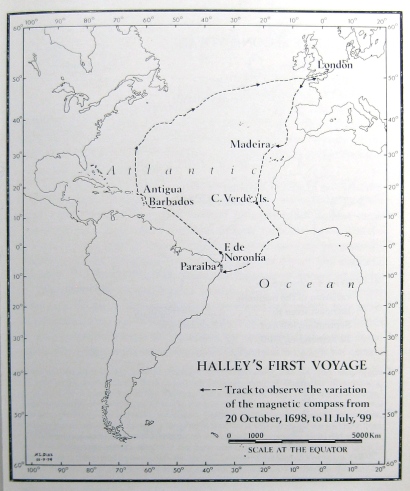
Track of Halley’s first voyage in the Paramore as reported in his Journal (© The Hakluyt Society (£))
